Monday, May 25, 2020

Our cities as the pandemic recedes.

Some environmentalists have been seeing a silver lining in the Covid-19 pandemic, viewing it as a potential inflection point marking when the world might turn away from fossil-fuel powered transport.  With the spread of the disease worldwide, freeways and city streets became empty of traffic almost overnight and many airlines cancelled most of their flights and went on to life support.  Not surprisingly as demand for oil plummeted, so did its price, although this was also due to Saudi Arabia drastically increasing its production to spite Russia over Russia’s prior refusal to come to an agreement to cut production.  

At the same time bicycle stores (viewed as essential businesses in UK, where Boris Johnson is a cyclist) saw a huge increase in sales, and also cities started to announce large-scale restructuring of urban streets to make life more friendly to pedestrians and cyclists.  Milan, an early victim of Covid, was also a leader in this, announcing plans to restructure its urban landscape. Its ‘Strade Aperte’ plan pledged to restrict automobile traffic on 35 km. of city streets, and to install new bike lanes and wider sidewalks.  Furthermore Milan plans to do this quickly - over this summer.  

Other cities have followed suit - in Oakland, California almost 10% of roadways have been closed to through-traffic; in Bogota, Colombia, 47 miles of temporary bike lanes have been opened. New York has begun trialing seven miles of "open streets" to ease crowding in parks, with Auckland, Mexico City and Quito among the dozens of other world cities experimenting with similar measures.  Here in Victoria the city council is considering plans to limit vehicular traffic on some streets during the summer to allow restaurants to expand seating space into them, so that they can more easily accommodate social distancing.  

None of this looks very promising for the automobile industry.  Indeed with the onset of the pandemic auto manufacturers saw their share prices plummet. In a very short period of time, the Dow Jones Auto Manufacturers’ Share Index plunged from 304 to below 134.  True other share prices saw similarly large drops.  But to some it did seem like the writing was on the wall for the auto industry.  

But wait!  Since the low on March 19, the index has progressed steadily upward and now stands at 252. So not everyone believes that there is no future for the traditional automobile. 

Doug Saunders, Globe & Mail columnist now resident in Berlin,  had an interesting article  on Saturday, offering a very plausible explanation for this.  


His argument is that Covid has to a large extent been a phenomenon of the suburbs.  He cites Paris and Stockholm, where the urbanites living close to the centre have been largely unaffected, while the suburbanites living far out have been badly hit.  And in New York, perhaps the worst hit city anywhere in the world, people in Manhattan have largely escaped, while those living in Queens or Long Island and other outlying suburbs, have suffered greatly.  This is especially true of poorer suburbs - think of the banlieus around Paris or the Bronx in New York.

Apart from being home to many poorer people, often immigrants, the other thing these suburbs have in common is that many residents rely on public transit, often in long commutes into the city.  And the close contact that is forced upon people in crowded trains and buses is likely one reason that the suburbs are suffering so badly.

Now as the first wave seems to be receding in many areas, and an opening up and return to work is beginning, people in these neighbourhoods are having to make some difficult decisions.  Do they carry on as before taking risky public transit, often with much longer journey times due to attempts at social distancing, or do they do everything they can, likely going into debt, to obtain transport of their own?  It’s a choice not unlike that facing society as a whole - how much debt and economic pain are we prepared to endure to reduce the risk of infection. Doug Saunders and presumably many in the auto industry, foresee many choosing the option of buying their own car.  Saunders quotes Volkswagen’s U.S. chief executive Scott Keogh

“We definitely do see a return to what I’ll call personal transportation and trust.” Cars, he said, are being pitched as sources of public safety.

So the auto industry may soon move into a new phase.   For the last decade or two it has been all about trucks, SUVs etc. Now they may see a boom in low cost passenger vehicles.  

If this does happen it will reverse what cities and urban planners have long been trying to achieve - to get people out of their own (low occupancy) cars and on to public transport.  It doesn’t bode well for air quality, congestion and the general livability of our cities.  It threatens to be yet another casualty of the novel Coronavirus.  But if you faced the choice of intermittent public transit with a high risk of Covid infection or a lengthy commute on a congested freeway, but in the relative safety of your own car, which would you choose?   
Thursday, April 16, 2020

Speed of response seems to be a major factor in limiting the spread of Coronavirus

I recall back at the time of the Athens Olympics, Sacha Baron Cohen in his assumed TV persona of Ali G, asked the question “Why did they give it to a rubbish country like Greece?”    Well lots of people, especially those who have visited Greece, would disagree with his characterization, but few I imagine, would hold up Greece as a model of good governance, especially after the financial crisis of 2015 and the revelations of the way Greece had been squandering the easy loans it had been receiving from the EU and elsewhere. 

But it seems that when it comes to managing COVID-19, Greece has done much better than most countries.   They have had the advantage of not being, like Italy, one of the first countries where it struck, but they seemed to have learned from the experience of Italy and Spain. 

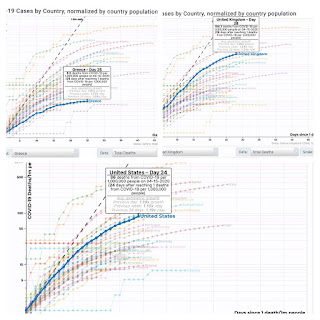
Before discussing what Greece did right, and US, UK and others did wrong, let’s look at the performance.  The first graph shows cumulative numbers of deaths normalized by population (deaths per million) on a logarithmic scale, against days since start (defined as when one death per million occurred).  While the US has had 86 deaths per million, Greece has only had 9.5 per million.  The UK has had a disturbing 194.1 deaths per million.  So the normalized death figures for US and UK are roughly ten and twenty times those for Greece.  


The number of deaths for the UK is probably a huge underestimate, because the UK is only recording hospital deaths.  In Canada close to half of COVID deaths have been linked to long-term care facilities for the elderly, most dying in the care homes themselves. There is no reason to think that things would be substantially different in the UK, so in fact the actual number of UK deaths could be closer to 300 or 400 per million, which makes its fatality rate among the highest in the world, along with Spain and Italy.   

A similar picture prevails if one looks at number of cases rather than deaths.  The second graph shows these numbers.  Greece has 204.4 cases per million, USA 1931.2  cases per million and UK 1497. 4 cases per million.  So again USA and UK have substantially more cases than Greece.


What is the reason behind these huge discrepancies?   This article by Eric Reguly goes into the steps that Greece took which others didn’t. 


It seems that the main thing is that they acted very quickly to isolate and shut down the spread. It was fortunate in that it had a new government with a strong mandate, and so was able to make tough decisions, without much dissent. It also was able to learn from the experiences of Italy and Spain.  For example Reguly informs that 

“All Greek schools were closed within 13 days of the first positive test. Italy did not shut its schools until 33 days after its first positive; Spain took 43 days. Greece’s schools were closed on the day the country reported its first coronavirus fatality. Italy waited 11 days and Spain 30 days. Non-essential shops were closed in Greece within four days of the first fatality. Italy waited 18 days and Spain 30 days.”

Compare this with what happened in US and UK.  In spite of Donald Trump trying to blame everybody but himself, especially the WHO, he must be held responsible for much of the slow response in his country.  

A full month after the WHO declared “a public health emergency of international concern” (on January 30) Donald Trump told a rally of his supporters (on Feb. 28) that "Thirty five thousand people on average die each year from the flu. Did anyone know that?  Thirty five thousand. That's a lot of people. And so far, we have lost nobody to coronavirus in the United States."
"Now, the Democrats are politicising the coronavirus… this is their new hoax."  Finally on March 13, the US declared a national emergency.  

The first case of COVID identified in the US was on January 19 in Snohomish County in Washington State.  So the US wasted six weeks.  

In contrast to the US as a whole, one state especially stands out for taking rapid action and keeping the outbreak under control. This is California, where Governor Newsom declared a state of emergency on March 4 and issued an order for Californians to stay indoors on March 19.   California now has one of the lowest infection rates per capita of all US states (see graph). 


The UK offers another example of delay causing a severe outbreak.  It was very slow off of the mark, at first adopting a policy of advocating protection of the frail and elderly while letting younger fit people get the disease to build up herd immunity. While proposed by the Chief Government Scientist and Medical Officer, this policy always seemed to me like an absurdity - basically saying we’ll let people get COVID this year to prevent them from getting it next year.  Perhaps with poetic justice both Boris Johnson and the Chief Scientist ended up contracting the disease.  

Boris Johnson, like Trump, adopted a very blasé attitude to the disease, going around shaking hands with people long after the WHO had warned against close contact.  The UK Government’s handling if the crisis represents a complete policy failure, following from which many people have died.  

To those with a mathematical background, it should come as no surprise that early action can be very effective.  If something is growing exponentially, reducing the initial state, by say fifty percent, will have the effect of reducing the state by fifty percent at every time point thereafter.  Even as growth from exponential slows, the scaling still applies.  

So it seems the arrogance and assumed superiority of Britain and the USA, or at least of their leaders, has led to disasters, which could have been, if not completely avoided, then greatly ameliorated. 

Will these leaders be held to account?  I would like to think so.   But Trump, with his optimistic if dangerous message seems to have maintained support at least of his base.  And by contracting the virus himself, Johnson may have earned the sympathy of many voters, notwithstanding the fact that to some extent his sickness was of his own doing. 

PS.  Since first posting this I saw the following, by Britta and Nicolas Jewell of Imperial College London and London School of Hygiene and Tropical Medicine, which reinforces the importance of early intervention:  

The recent divergence of epidemics in Kentucky and Tennessee shows that even a few days’ difference in action can have a big effect. Kentucky’s social distancing measure was issued March 26; Tennessee waited until the last minute of March 31. As Kentucky moved to full statewide measures in reducing infection growth, Tennessee was usually less than a week behind. But as of Friday, the result was stark: Kentucky had 1,693 confirmed cases (379 per million population); Tennessee had 4,862 (712 per million).


Monday, April 13, 2020

If the shale industry goes down, who will it take with it?

The BBC on Sunday reported that ‘Opec producers and allies have agreed a record oil deal that will slash global output by about 10%’.  In March the price had dropped dramatically because of a perfect storm which saw a headlong drop in demand caused by the Coronavirus coupled with a large increase in supply due to Saudi Arabia precipitously increasing production after it failed to reach an agreement on production quotas with Russia.  It was yet another abject failure by the young hothead who seems to call the shots in Saudi Arabia, Prince Mohammed bin Salman.

Whether or not this agreed cut will hold, and if it does whether it will restore the price of oil to any thing like what it was at the start of the year, remains to be seen.  I somehow doubt it will.  However even if it does I doubt if it will rescue the shale oil industry in the United States, from what looks like a very shaky future.  

Hydraulic fracturing, or fracking as it is more widely known, was first proved to be commercially viable in 1997. It works by pumping liquid at high pressure into horizontally distributed oil deposits in shale rock formations, below the surface.  It has been used in producing oil and gas on a large scale for ten to fifteen years.  But in that time it has turned the industry on its head.  The USA used to worry about its increasing dependence on oil imports, but in that ten year span it has not only become self-sufficient and more, it has become the world’s largest oil producer, eclipsing even Saudi Arabia.  

Perhaps this energy independence has been one of the causes of increased American self-assertion on the world stage.  No longer reliant on Middle-Eastern oil, it no doubt feels it can afford policies, which lead to de-stabilization of the region, such as its support of jihadi rebels and civil war in Syria and the extreme tilt towards Israel, which has occurred during Donald Trump’s presidency.  In fact instability in the energy ‘breadbasket’ of the Middle East, actually helps American shale producers by keeping oil prices high.  It could be argued that this is one of the reasons for Trump’s antagonistic policies towards Iran - to keep Iranian oil off of the market.  

Something not mentioned often in the triumphal boosting of the newfound American energy supremacy, is the fact that the industry can only be economically viable with energy prices suitably high.  The break-even price for shale oil is put between $48 and $54 (USD) a barrel. Last week the price (West Texas Intermediate) bottomed out at around $20.   Understandably the Trump administration worked very hard to get  the Saudis and others to reduce production.  But even with the reported success in getting an agreement, it seems unlikely that prices will rise to the $50 a barrel needed for shale oil to make a profit.  

But the story is worse than that.  In an article in the New York Times on Sunday, author Bethany McLean https://www.nytimes.com/2020/04/10/opinion/sunday/coronavirus-texas-fracking-layoffs.html 
pointed out that very few shale oil producers have actually made any profit over the last ten years.  The way the shale-oil producers have stayed in business is by drawing in billions in capital from investors convinced by the years of high energy prices and the talk of ‘peak oil’ that, in the long run, the supply of this non-renewable resource will dwindle and push prices up.  In essence it has been like a Ponzi scheme.

To date this has kept most producers in business, but the current Coronavirus shock to prices is beginning to take its toll, with shutdowns and some bankruptcies (McLean mentions Whiting Petroleum whose stock once traded at $150 per share).  Will investors still be prepared to pump money into an industry that hasn’t made any money during ‘good years’ now that the ‘bad years’ are here?  No doubt many will start looking more closely at the way the shale oil industry operates, and whether it will ever be able to yield a return on investment even if prices rise well above $50 a barrel.  For example the McLean article quotes hedge fund manager David Einhorn who analyzed 16 publicly traded shale companies and found that between 2006 and 2014 they spent $80 billion more than they received from selling oil.  

Industry boosters argue that technological innovation will reduce costs and help make the industry more profitable.  But the geology seems to suggest things will move in the opposite direction. The history of fracking seems to indicate that production from any well drops off sharply after about a year or so, forcing the search for new sites.   And when wells are clustered too close together, extraction from one negatively affects the other wells. 

Even before the current price shock investors were beginning to become impatient and wanted to see some return on their investments, before sinking more money into these companies.  Indeed in September of 2018, Ms. McLean published an article (again in the NY Times) 
pointing out all of these financial problems with the fracking industry.  But the gist of her article was the suggestion that the collapse of the shale oil industry could bring about a financial collapse, not unlike the sub-prime collapse of 2008.  

Moody’s reported that in the third quarter of 2019, 91% of defaulted corporate debt was because of oil and gas companies. Ms. McLean writes  ‘And North American oil and gas drillers have almost $100 billion in debt that is set to mature in the next four years.’  

‘It’s still unclear where most of this debt is held.  Some of it has been packaged into so-called collateralized loan obligations, pieces of which are held by hedge funds.  Some of it may be on bank balance sheets’.   It all sounds very much like the mortgage debt of the sub-prime crisis of 2008.  It could well be that, as Bethany McLean titled her 2018 article, ‘The next financial crisis lurks underground’.  


Monday, March 30, 2020

What a simple mathematical model can tell us about Covid-19


There are certain characteristics of disease outbreaks which are common to many epidemics, and mathematicians and epidemiologists have captured some of these aspects in simple analytical models.  In this post I will introduce one such model and discuss what can be learned about the Covid-19 from it. 

One of the oldest and simplest mathematical models for an epidemic is the so-called S-I-R model introduced by Kermack and McKendrick in 1927.  And I think it provides a good first approximation to the dynamics of the current Coronavirus epidemic, and can provide some important insights. 

In this compartmental model there are three ‘compartments’ - ‘Susceptibles’, S;  ‘Infectives’, I; and ‘Removed’, R.  This last class includes those who have had the infection and are no longer susceptible either through acquired immunity or death.  The dynamics of the disease are described by the three equation of motion:  

dS/dt = −β S I/N

dI /dt = β S I/N - νI 

dR/dt = ν I,

where N is the total population size (= S+I+R) and β and ν are parameters. 

The left-hand sides are the time rates of change, e.g number of new Susceptibles  (or Infectives or Removed) per day.    The rate of infections (rate at which individuals move from Susceptible to Infective class) is β S I/N.  Note that it is assumed to depend on both the current number of Infectives, I,  in the population and the current number of Susceptibles, S.   For a fixed value of S, the number of infectives is growing exponentially at the rate (β S /N - ν) because then dI/dt = (β S /N - ν) I.    So the epidemic is growing fastest when S is largest i.e. when it is at its initial value S0 =  N when the disease is first introduced.  

The term ν I  represents the rate at which Infectives are removed either by recovery or death. 

Although there are two parameters in this system,  β and ν, it is easily shown by re-scaling that its behaviour depends only on the ratio 

R0 =  β/ν.  

This quantity is very important and is known as the basic reproduction number.  It represents the maximum expected number of new Infectives for any single infected individual.   As one might expect if R0 is less than one, no epidemic arises.  But if R0 is greater than one an epidemic breaks out.  

If one writes the right hand side of the second equation as (β S /N - ν) I, one can see that the number of infectives is growing (dI/dt > 0) if βS/N−ν > 0; and is decreasing if βS/N−ν < 0.  In other words the epidemic is growing all the time that S >N ν/β=N/R0; and is declining if S < N/R0.  The peak of the outbreak thus occurs when the number of susceptibles S is reduced to N/R0.  

This also tells us how many people need to become immune, in order to achieve so-called herd immunity.  Herd immunity occurs in a population when the number of susceptibles is not large enough to maintain an epidemic.  It can often be brought about by vaccination, but unfortunately not yet for Covid. 

From the calculations above an epidemic will not occur if  S < N/R0, or if the number with immunity is greater than N- N/R0 N(R0-1)/R0 . 

Thus the percentage of the population required for herd immunity is 100(R0-1)/R0 %.  Estimates of R0 for Covid-19 vary, but a study from Wuhan published in Lancet put it at about 2.3.  A study of cruise ship infections had a similar estimate. This suggests that it would require immunity in about 57% of the population.  However there was uncertainty in the estimates.  The Lancet study gave a 95% confidence interval of 1.15 to 4.77, which suggests that to obtain herd immunity somewhere between 13% and 79% of the population would need to become immune. So there is still a great deal of uncertainty with regard to R0 and herd immunity. 

Also by writing the right hand side of the equation for the dynamics of I, one can see why an epidemic occurs only if the basic reproduction number R0 is greater than one.  For if initially S0 = N then, initially dI/dt =  (β S0/N - ν) I =  (β - ν) I  = ν(R0-1) I, which will be positive if R0 > 1 and negative otherwise.   

Explicit solution of the differential equations is is not easy, in terms of simple functions.  But qualitative behaviour and numerical solutions are easy to obtain.  The graph below shows typical trajectories (in the case R0 > 1) of the numbers of Infectives (green)  Susceptibles (blue) and Removed (red) are as shown in the graph. 

What is important is that the height of the peak, and the number uninfected when the epidemic is over both depend on R0.  The larger R0, the higher the peak and the smaller the number escaping the disease.  

So from the public health point of view reducing R0 is of major importance. This can be done by making the numerator, β, smaller or the denominator, ν, larger.  The first can be achieved by reducing contact between Infectives and Susceptibles (social distancing, self-quarantine) and the second by isolating Infectives.


Another conclusion from this model is that the epidemic ends through there being insufficient Infectives to keep it going, so that at the end there is a positive number of Susceptibles who never get the disease. 

Kermack and McKendrick successfully used the model to describe the behaviour of a plague outbreak in Bombay in 1906, and other historical epidemics for which data existed.  A graph from their paper is shown.


There are more sophisticated models of Covid-19 which include such things as age structure in the population, stochastic effects and more.  A video lecture describing some of these models is availability here 
https://www.youtube.com/watch?v=dLVLEZMzIOk


Thursday, March 26, 2020

Who will be held responsible if Julian Assange dies?

Is the UK Government hoping that Julian Assange will die of Covid-19 and thus solve its extradition problem?  He is reported to be in frail health, and his request for bail to be released from confinement, because of the Covid risk, has been turned down. 

117 medical doctors, including several world prominent experts in the field, published a letter in the Lancet warning that Assange’s treatment amounts to torture and that he could die in jail.   Should Assange die in a UK prison, as the UN Special Rapporteur on Torture has warned, he will effectively have been tortured to death. Much of that torture will have taken place in a prison medical ward, on doctors’ watch. The medical profession cannot afford to stand silently by, on the wrong side of torture and the wrong side of history, while such a travesty unfolds.

From everything I have read about his extradition hearing, being held in Belmarsh Prison, it is a travesty of British justice and more like something one might expect in Russia (either in Soviet days or now).  

For example:  The International Bar Association’s Human Rights Institute (IBAHRI) condemns the reported mistreatment of Julian Assange during his United States extradition trial in February 2020, and urges the government of the United Kingdom to take action to protect him. According to his lawyers, Mr Assange was handcuffed 11 times; stripped naked twice and searched; his case files confiscated after the first day of the hearing; and had his request to sit with his lawyers during the trial, rather than in a dock surrounded by bulletproof glass, denied.

It is worth remembering that Julian Assange is a remand prisoner who has served his unprecedentedly long sentence for bail-jumping. His status is supposedly at present that of an innocent man facing charges.

Tuesday, March 24, 2020

After the pandemic recedes

As we struggle with the crisis of the spread of Coronavirus and the measures necessary to contain both it and the damage it has induced in the economy and elsewhere, it maybe worth thinking about how the world will look once it has receded.  Of one thing I am quite sure - that a very different world will emerge at the end of it.

Given that the Coronavirus originated in China and caused great damage there, it may sound sound counter-intuitive, but I believe that China will come out of the pandemic with its power and position in the world enhanced.

When the epidemic arose in Wuhan and quickly spread through Hubei province and threatened other parts of the country things looked very bad for China.  Lunar New Year celebrations were put on hold and much of the country was put on lockdown.  Factories and businesses closed and supply chains were interrupted, resulting no doubt in a big drop in first quarter output.  

Things didn’t look too good for the Communist Party leadership either, when it was revealed how Party officials in Wuhan had tried to cover up the outbreak and had punished the doctor who had first spoken out about it.  There were even reports of public unhappiness with the leadership Chairman Xi.   Coupled with the concurrent unrest in Hong Kong, the virus epidemic looked as if it might cause the ground to shift a bit under the feet of the autocratic leadership.

But now as we near the end of March, things look quite different.  China seems to have gotten on top of the virus with no new cases of community spread reported in Wuhan for several days.  Furthermore it is sending medical equipment and advice to various other hard-hit countries including Iran and Italy.  And it is Western countries that are struggling to control the virus and whose economies seem to be going into a tailspin.

Apart from the propaganda success, there is another way in which China is gaining.  The US and other Western countries have announced massive spending programs, at first in an attempt to prevent the collapse of the stock market and ensuing financial mayhem, and subsequently to help protect workers who cannot earn a paycheck through businesses going under or through enforced self isolation.  The deficits will be enormous - certainly involving many trillions of dollars.  And the governments incurring these massive deficits are, for the most part, already up to their eyes in debt, much of it incurred following the 2008 financial crisis, when banks and financial institutions were bailed out.  And the worst borrower by far has been the US Government, which has continued to fight wars around the world and dramatically increase its military budget, while at the same time, cutting taxes at home.  

I am not entirely confident that I understand how government deficit financing operates, but I think it is mostly through the selling of Treasury bills.  And who has the reserves to buy such bonds (i.e. to lend such gargantuan sums of money)?  I think the answer is China.  So when it all shakes down, the US (and other Western nations) will be massively in debt to China.

Perhaps the US Treasury can simply create money with a few keystrokes on computer? But history teaches that artificially creating money out of thin air, as was tried by the Ancien Regime before the French Revolution and by Weimar Germany, can lead to hyper-inflation and social and political dislocation.

So however these massive debts are financed, it looks to me as if the long-term winner will be China. The way China is bringing the epidemic under control with fewer deaths even than Italy, and a medical disaster emerging in the US, will all combine to make the authoritarian Chinese system seem attractive to many non-Western countries.  Coupled with a debt-ridden capitalist West, with its liberal democracy tainted by extreme inequality, and an electoral system that can result in the election of a narcissistic reality TV huckster, who didn’t even obtain a plurality of votes, the moral supremacy of the West looks definitely shaky.  

It could turn out that the Coronavirus will be seen as the catalyst which led to China  replacing the USA as the world’s number one power, just as World War II saw Britain being replaced by the US.  I can’t say I want it to happen, but in many ways the US, with the rest of the West tagging along, will have brought this unattractive outcome on itself.